A Beginner's Guide to UK Postcodes for Geospatial Analysis
October 09, 2026 - Geodata

October 09, 2026 - Geodata
October 05, 2026 - Maps

October 04, 2026 - Tutorials

September 30, 2026 - Technology
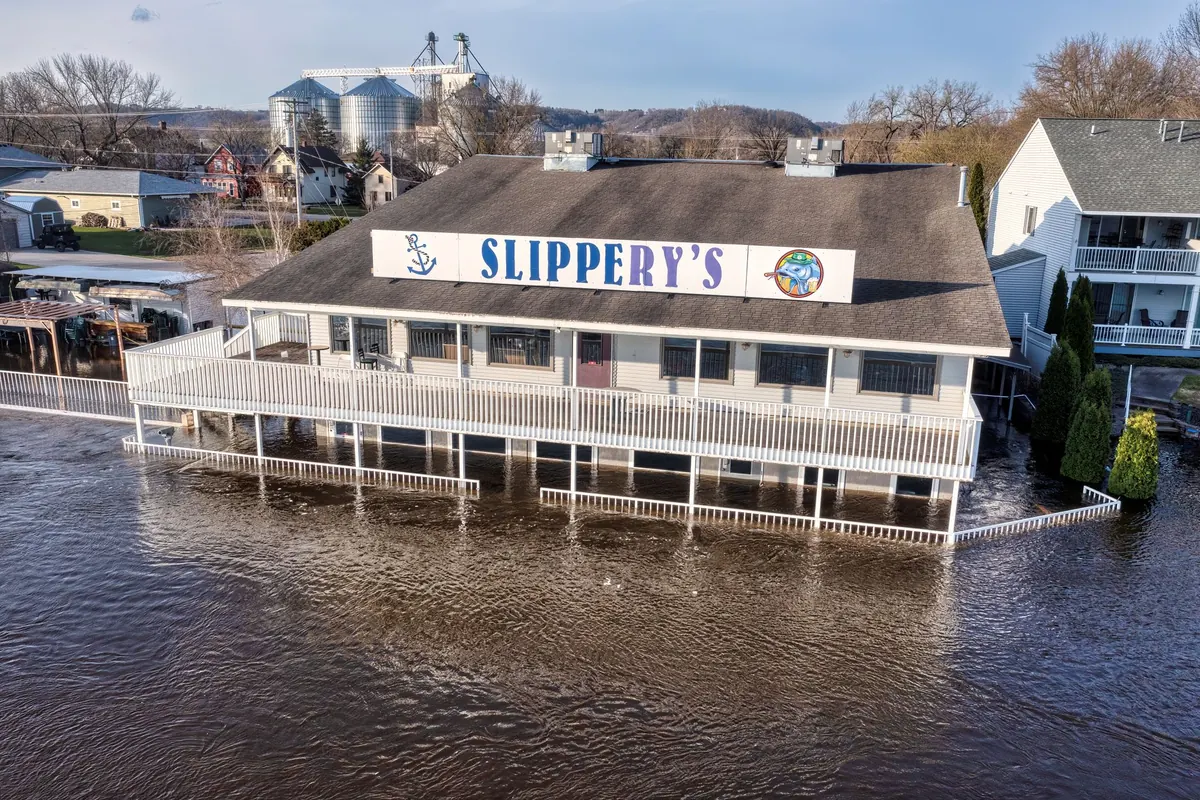
The first named storm of the season usually arrives with a few days' notice. By then, if you look after a council's emergency planning, a utility's asset register or a portfolio of properties near a river, the useful work has already been done. Autumn is when the datasets get refreshed, the layers get checked and the maps get printed. Winter is when they get used.
What follows is a working checklist for anyone mapping UK flood risk: the sources worth knowing, the order to assemble them in, and the checks that are easy to forget until the water is already rising. None of it is glamorous. All of it is cheaper than a phone call from a resident standing in six inches of water asking why nobody warned them.
Most flood mapping projects go wrong at the framing stage, long before anyone opens QGIS. "Where does it flood?" is not a question a map can answer usefully. These are:
Each of those needs different data at a different resolution. A district-wide overview can live with postcode-level precision. An evacuation plan for a single village cannot, because the difference between a property on the high side of the lane and one on the low side is the difference between a dry week and an insurance claim. Write the question down before you start downloading and you will save yourself a fortnight of rework.
It also helps to keep flood risk and flood hazard apart. Risk is probability multiplied by consequence — how likely, and what is lost. Hazard is the physical description: depth, velocity, duration, how fast the water arrives. National datasets mostly give you risk. If you need hazard, you are into local modelling, and you should budget for it accordingly.
England has the deepest well. The Environment Agency publishes the Flood Map for Planning, which splits land into Flood Zones 1, 2 and 3 — Zone 1 below a 1 in 1,000 annual chance, Zone 2 the band between 1 in 100 and 1 in 1,000 from rivers, Zone 3 the highest. Alongside it sit separate maps for surface water, reservoirs and groundwater, the National Flood Risk Assessment and the Historic Flood Map, and the whole lot is generally available through the Defra Data Services Platform under the Open Government Licence, either as downloads or as WMS and WMTS feeds you can point a GIS at directly.
Scotland uses SEPA's flood maps, which go further than the English planning layer by publishing hazard and risk maps for river, coastal and surface water flooding in one place. Wales is served by Natural Resources Wales' Flood Risk Assessment Wales and the Development Advice Map that sits behind TAN15. Northern Ireland has the DAERA flood maps and the strategic mapping carried over from the old Rivers Agency work.
That is the national picture. It is a starting point, not an answer, and it is coarse — typically 1:10,000 or finer for main rivers, much vaguer for ordinary watercourses. The detail that decides whether one specific address floods lives in local sources: Strategic Flood Risk Assessments, the Section 19 reports that lead local flood authorities must publish after a significant event, utility asset data, and the institutional memory of whoever has been on the phone to the drainage team since 2007.
Order matters more than most people expect, because each layer changes how you read the one beneath it.
Between September and the end of October, the job is housekeeping. Re-download the national layers, because they are refreshed periodically and you want the current version, not last winter's. Check your licences and your attributions. Record the version date of every dataset in the project file, so that in February you can tell a colleague exactly which map they are looking at. Print the packs that will be needed during a power cut. Save offline copies of anything that lives behind a login. And update the contact list, because the person who knew how to read the model output has probably moved teams.
Once the first warning lands, the map stops being a project and becomes an instrument. Keep it simple. Highlight the properties, the access routes and the assets, and put a timestamp on the screen. If a road closure changes the picture, update the map rather than the conversation. Keep a running log of what you used and when — it is the fastest way to answer the questions that arrive after the water goes down.
A flood map is only as good as the last person who asked whether it was still true.
The most useful thing you can do in the quiet weeks after an event is to add what you learned: photographs with coordinates, high water marks, the culvert that turned out to be blocked, the road that closed earlier than the map predicted. Next autumn's checklist writes itself if this winter's observations were recorded properly.
Autumn is short and winter is long. Do the boring work while the rivers are low, and the map will hold up when the first named storm arrives.
Photo: Tom Fisk / Pexels
A practical introduction to UK postcode structure, geocoding options and aggregation choices for mapping location...
A practical guide to England and Wales' definitive maps, CRoW access land and the open data sources you can use to...
October 09, 2026 - Geodata
October 05, 2026 - Maps
October 04, 2026 - Tutorials
Copyright © 2026 Atlas Bit. All Right Reserved.