A Beginner's Guide to UK Postcodes for Geospatial Analysis
October 09, 2026 - Geodata

October 09, 2026 - Geodata

October 05, 2026 - Maps

October 04, 2026 - Tutorials

September 30, 2026 - Technology
UK postcodes look simple enough: a few letters and numbers, a space, then a few more. Put them on a map and questions appear. Should you plot every unit, or group them by sector? Which coordinate do you use? Why do two addresses in the same postcode appear kilometres apart? The answers shape whether your location analysis stands up.
A postcode is a mail routing label. It identifies a group of delivery points, usually a handful of addresses on one side of a street, though rural units can cover a long road or several scattered properties. It is not a neighbourhood boundary, a council ward, or a perfect polygon. Treat it as an operational label that is useful for linking addresses to geography.
Postcodes change. Royal Mail creates, splits, merges and retires them as buildings and delivery rounds change. Any serious analysis needs a dated lookup. If you keep only the postcode text, you lose the version that made it valid.
Every UK postcode has two halves: the outward code and the inward code. Take SW1A 1AA. The outward code is SW1A; the inward code is 1AA. The hierarchy runs from broad to narrow:
Examples from different nations help: EH1 1YZ in Edinburgh, CF10 1EP in Cardiff, BT1 1AA in Belfast. The format is consistent, but the data sources and geographies behind them are not always the same.
Geocoding turns a postcode into a location. In the UK, the usual result is a postcode centroid: a single coordinate representing the postcode unit. The most common sources are the ONS Postcode Directory (ONSPD) and the National Statistics Postcode Lookup (NSPL). Both cover the UK and include administrative geography codes. Code-Point Open provides postcode centroids for Great Britain, but not Northern Ireland. For Northern Ireland, use UK-wide products or the relevant Land & Property Services and NISRA datasets.
A typical geocoding workflow looks like this:
Bulk files are better for large datasets; APIs suit small jobs or one-off checks. Whichever route you take, record the lookup version and date.
Postcode units are precise but often too sparse or unstable for a useful map. Aggregating to sectors or districts reduces noise, makes patterns easier to see, and helps protect privacy. The right level depends on your question and your data volume.
Always consider denominators. A map of raw counts will usually just show where more people live. Rates per household, per person or per square kilometre are often more informative. Census and lookup files can provide population or household counts for common geographies.
Most postcode analysis ends with a join to administrative or statistical boundaries. ONSPD and NSPL include codes for local authorities, Westminster constituencies, health areas, LSOAs and MSOAs in England and Wales, Data Zones in Scotland, and Super Output Areas in Northern Ireland. These codes let you aggregate postcode records into areas that are stable for a census period.
For mapping, join your aggregated table to boundary polygons from the ONS Open Geography Portal, Boundary-Line or equivalent national sources. Check that boundary vintages match your lookup. An LSOA 2011 code joined to LSOA 2021 boundaries will produce errors, odd shapes or missing data. If you need postcode sector or district polygons, check coverage and licensing carefully; they are not always published in the same way for every part of the UK.
Postcodes are convenient, but they carry assumptions. Watch for these common problems:
A postcode is a delivery route, not a social boundary. Use it to link data to place, then be explicit about the place you have chosen.
Start with a small, well-defined area. A single city or council boundary is easier to check than the whole UK. Then follow a repeatable sequence:
That last step is not paperwork for its own sake. Postcode data changes, and a map without its version details is hard to trust or reproduce. Once you are comfortable with one city, repeat the process for a region and compare the results. You will quickly learn where the data is strong and where it needs caveats.
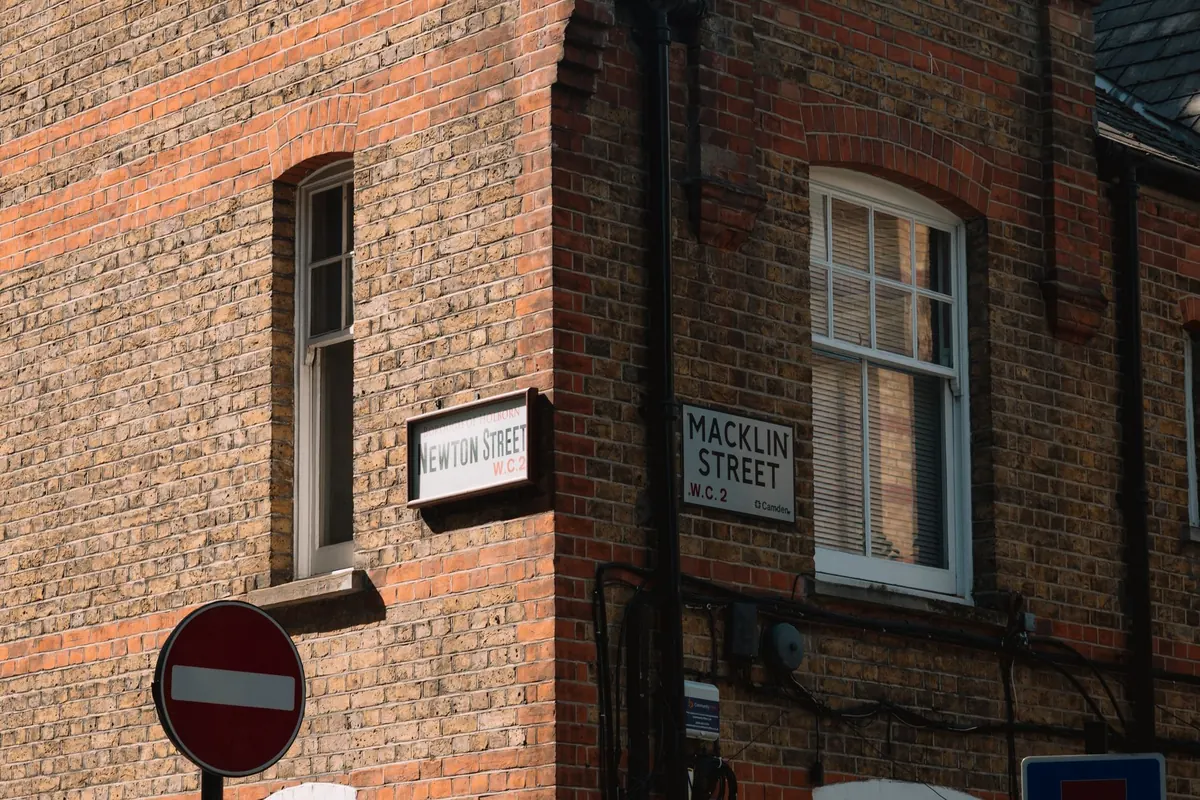
Photo: Joaquin Carfagna / Pexels
A practical guide to England and Wales' definitive maps, CRoW access land and the open data sources you can use to...
A practical walkthrough for tidying messy tables before mapping: stripping duplicates, correcting coordinate formats...
October 09, 2026 - Geodata
October 05, 2026 - Maps
October 04, 2026 - Tutorials
Copyright © 2026 Atlas Bit. All Right Reserved.